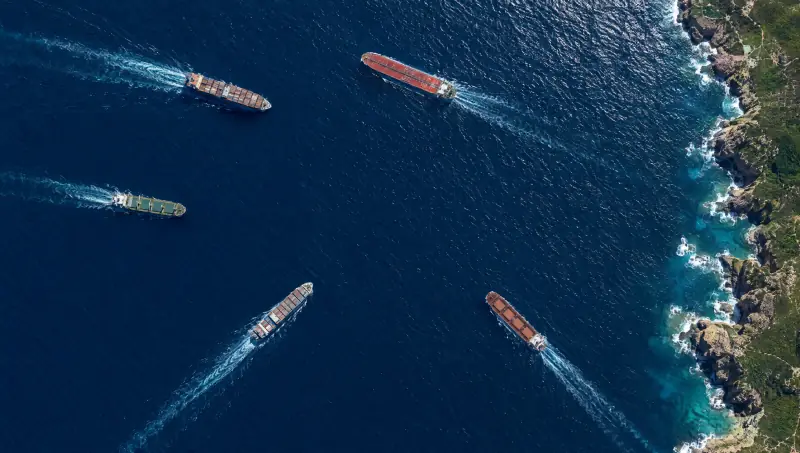
Five cargo ships off a rocky coast, each held as a track with its speed and heading. One has stopped transmitting its position and is flagged.

Domain 02 Sea

On the roadmapPlanned to run on the same models and command picture as the rest of Vamocles.

From the shipping lane to the seabed.

Vamocles tracks every vessel in the picture, flags the ones that go dark, keeps routes clear of danger and watches the pipelines and cables on the seabed below.

Trade arrives by sea. Energy and data run beneath it. Vamocles keeps all of it in one picture.

  1. 01

    Vessel tracking

    Every contact becomes one track, whichever sensor saw it: AIS reports, coastal radar, satellite and drone imagery. Course, speed and history stay with the ship as it passes from one feed to the next.

    AISRadarImagery
  2. 02

    Dark-vessel detection

    A ship that stops transmitting does not disappear. Vamocles matches every visual contact to a transmission, flags the ones that go quiet and keeps their last reported position on the chart.

    CorrelationAlerting
  3. 03

    Navigation and route safety

    Restricted areas, safety zones and hazards sit on the same chart as the traffic. When a course crosses one, the system proposes a safe route and the bridge decides.

    ZonesRouting
  4. 04

    Port and coastline watch

    Approaches, anchorages, berths and the coast between them, watched from the shore, the air and orbit. Loitering, unusual approaches and unannounced arrivals are raised early, with the evidence attached.

    PortsCoastline
  5. 05

    Subsea pipelines and cables

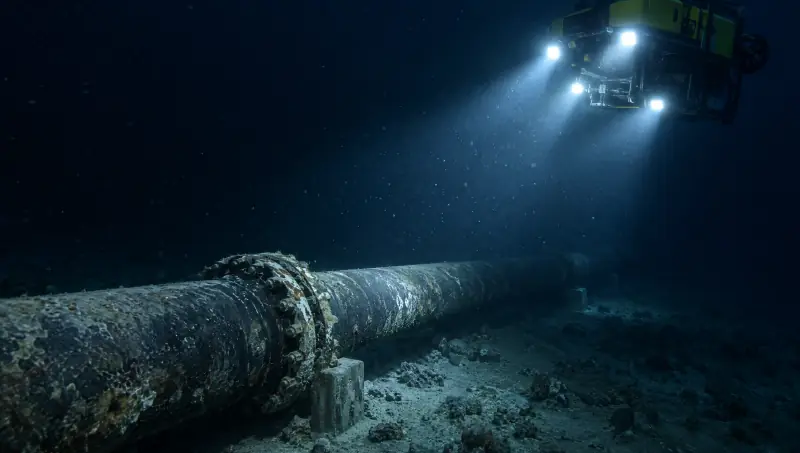
    Underwater vehicles inspect pipelines and cables along planned routes, and every finding is pinned to its point on the line. On the surface, a vessel that slows, anchors or loiters above one is flagged.

    Underwater vehiclesInspection
  6. 06

    Search and rescue at sea

    From a mayday or a person overboard to a coordinated search: drift worked out, search areas drawn, drones and vessels tasked, and every rescuer working from the same picture.

    Search planningTasking

Every ship on the surface. Every pipe and cable beneath it.

The picture follows the water down. The vessels above a pipeline and the vehicle inspecting it share one screen, so a ship that anchors over a cable is never someone else’s problem.

The maritime picture.

Five vessels off a rocky coast, a restricted zone and a pipeline on the seabed beneath it.

Satellite view of five cargo ships off a rocky coast
The maritime picture: five vessels tracked off a rocky coast.

Select a ship on the map or in the list. Every action has a button, and the arrow keys move through the contacts.

How a dark vessel is caught

Silence is a signal too.

Switching off a transponder hides a ship from anyone relying on AIS alone. It does not hide it from radar, from orbit or from a drone.

  1. Fuse

    AIS reports, radar returns and imagery arrive on one chart, each tagged with its source.

  2. Correlate

    Every contact that can be seen is matched to a transmission. Most match. The ones that don’t stand out.

  3. Flag

    A contact with no transmission is flagged with its last reported position and what lies on its course.

  4. Act

    People decide: send a drone to verify, notify the coastguard, warn the assets in its path.

Where it matters

Every water has its watch.

The same picture serves a harbour master, an energy operator, a coastguard and a fleet manager.

Offshore energy

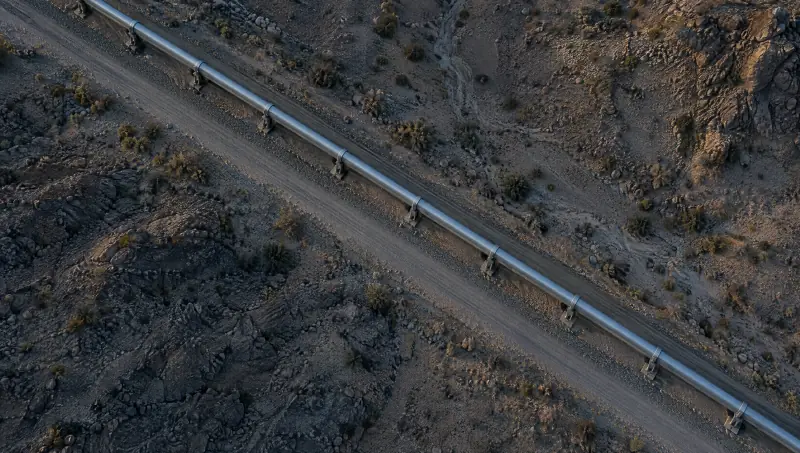
Pipelines, platforms and wind farms, from the seabed up.

Inspection routes planned and run by underwater vehicles, findings pinned to the line, and restricted zones on the surface held while the work goes on below.
Subsea cables

The data under the sea.

Cable routes on the chart, with an alert when a vessel slows, drifts or drops anchor above one.

Ports and coasts

Know every arrival before it berths.

Approaches, anchorages and the coastline between ports watched as one, with unannounced arrivals and loitering raised early.

Coastguards and rescue

One picture for every rescuer.

Distress calls, drift, search areas and every unit tasked to them, shared between the rescue centre, the air and the boats.

Protected waters

Hold the line where fishing stops.

Marine protected areas and closed fisheries drawn on the chart, and the vessels that linger inside them flagged with their track.

Shipping and fleet operators

Your fleet, kept clear of trouble.

Every ship in the fleet on one screen, routes checked against restricted and high-risk waters, and a safe alternative proposed before a course becomes a problem.

Search and rescue at sea

When someone is in the water, minutes are the whole story.

Vamocles turns a last known position into a search plan and puts every unit on it, so the rescue centre, the drones and the boats work from the same picture.

  1. 01
    DatumThe last known position, from a distress call, an alarm or a track that stopped.
  2. 02
    DriftWind and current move the search area before anyone arrives. The plan moves with it.
  3. 03
    SearchPatterns drawn for each unit: an expanding square for a drone, a sector for a lifeboat.
  4. 04
    FoundThe first sighting reaches every unit at once, with the position to steer to.
Search plan2 units tasked