Every asset in one register.
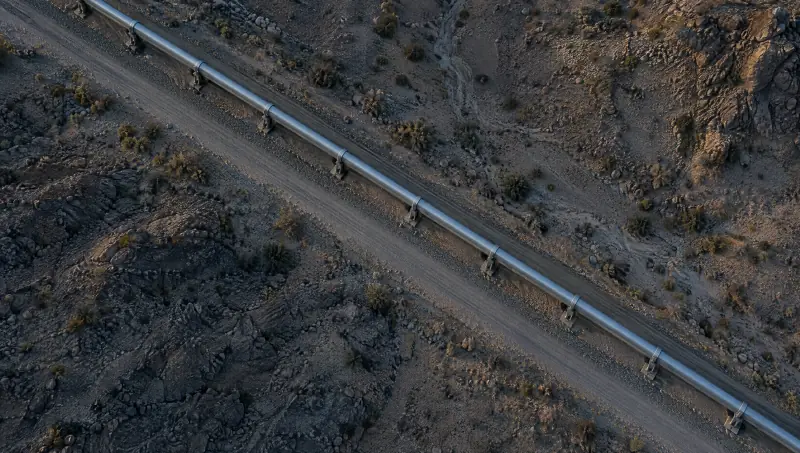
Pipelines, compressor stations, valves, substations, feeders, antennas, berths and fibre routes, held with their location, owner and condition. Each asset knows what it feeds and what it depends on.
Domain 05 — Infrastructure
The assets a country runs on were built apart and now fail together.
In developmentModels for this domain are in development. Across Vamocles, two pilots are underway with businesses.
One network
Gas, power, data and ports were built by different people in different decades, each with its own control room. Now each depends on the others.
What Vamocles does
Vamocles is the intelligence and command layer over the assets you already run.
Pipelines, compressor stations, valves, substations, feeders, antennas, berths and fibre routes, held with their location, owner and condition. Each asset knows what it feeds and what it depends on.
What your control systems already measure, joined by what the other domains can see.
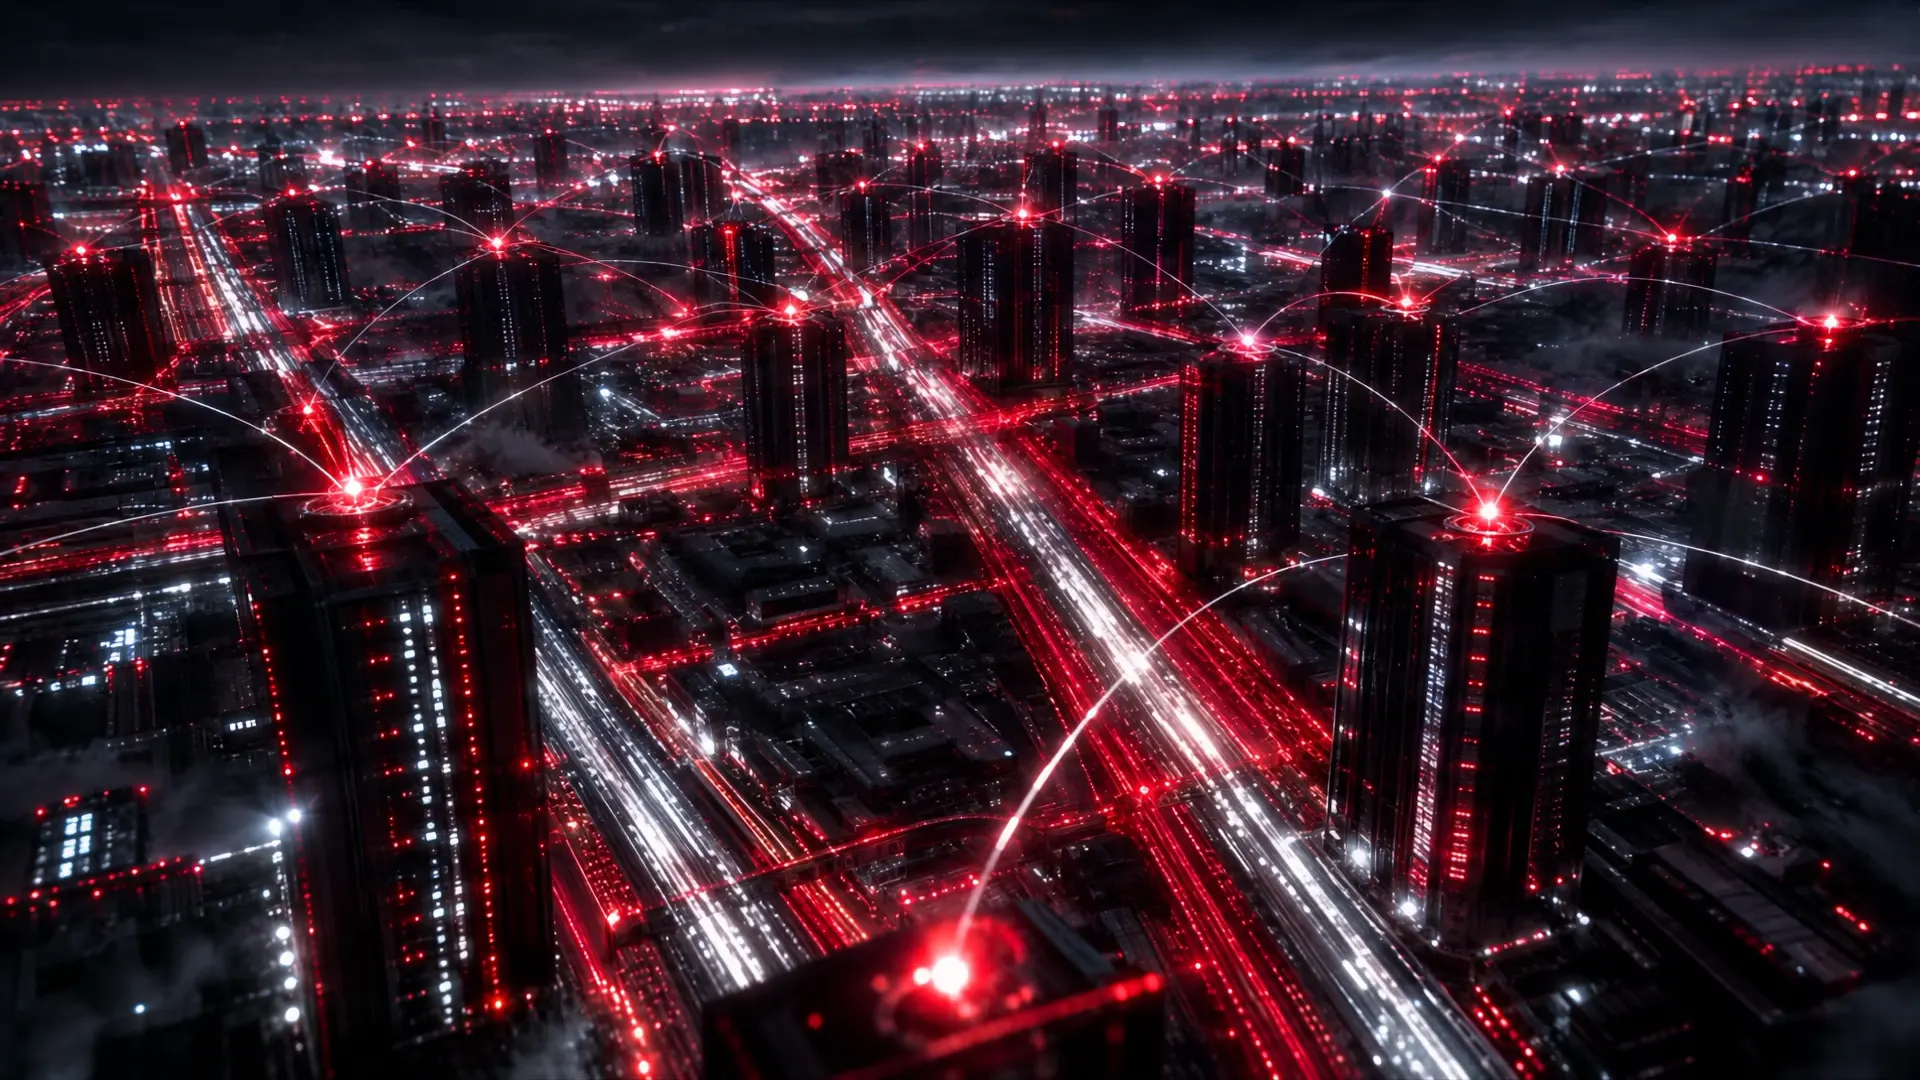
Which substation feeds the ground station. Which compressor keeps the power station in fuel. A fault shows its reach the moment it starts.
Readings are judged against what each asset normally does at that hour, load and weather. A pressure drop rises to the top. The noise does not.
Below bandLine pressure, KP 176
Suggested actions arrive with their consequences. People with the authority decide. Vamocles tasks the drone, alerts the crews and tells every control room what changed.
One incident
Take one region: 212 kilometres of gas pipeline, a power station and its substation, a ground station and a port.
An interactive console for a regional infrastructure network: a gas pipeline, a power-grid segment, a ground station and a port. It needs JavaScript.
Every line on the map is a dependency the system knows about. When one asset falters, the chain is traced before anyone has to ask.
Isolation, rerouting and dispatch are suggestions until someone with the authority confirms them. Nothing moves on its own.
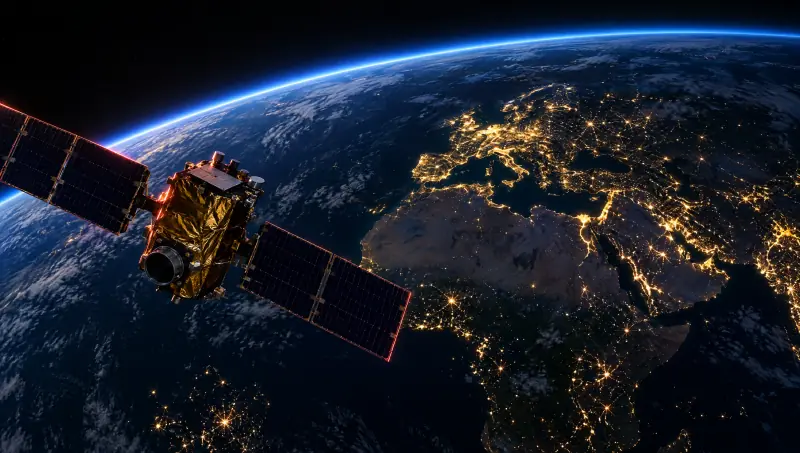
The drone that answers comes from Air. The imagery that shows the ground moving comes from Orbit. It all lands on the same map.
The same system, the same map and the same command picture, whether the asset carries gas, power, water, data or ships.
Pressure and flow along every kilometre, drone patrols over the right of way and satellite passes over the remote sections. A drop at one station shows which plants, power stations and terminals downstream depend on it.
Substations, feeders and transmission lines on the same map as the fuel that feeds them. Vegetation creeping towards a line, a transformer running hot or a feeder dropping out is raised with what it will take down next.
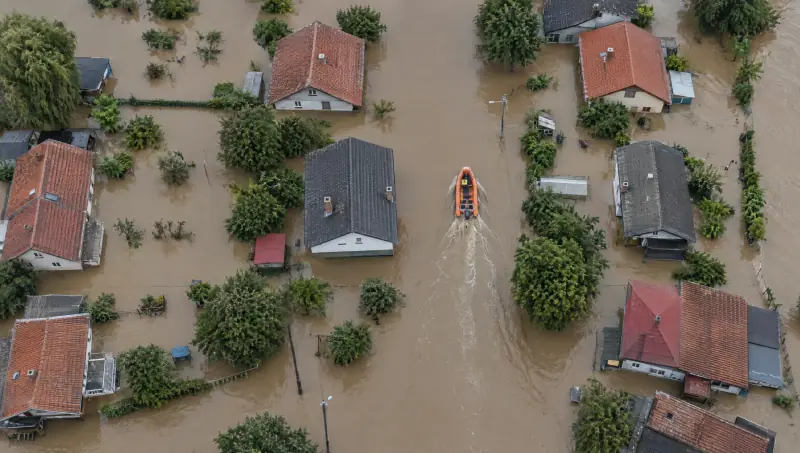
Pump stations and treatment works depend on power, and towns depend on both. Vamocles watches levels, pumps and defences together, and when a river rises it shows which works and which streets are next.
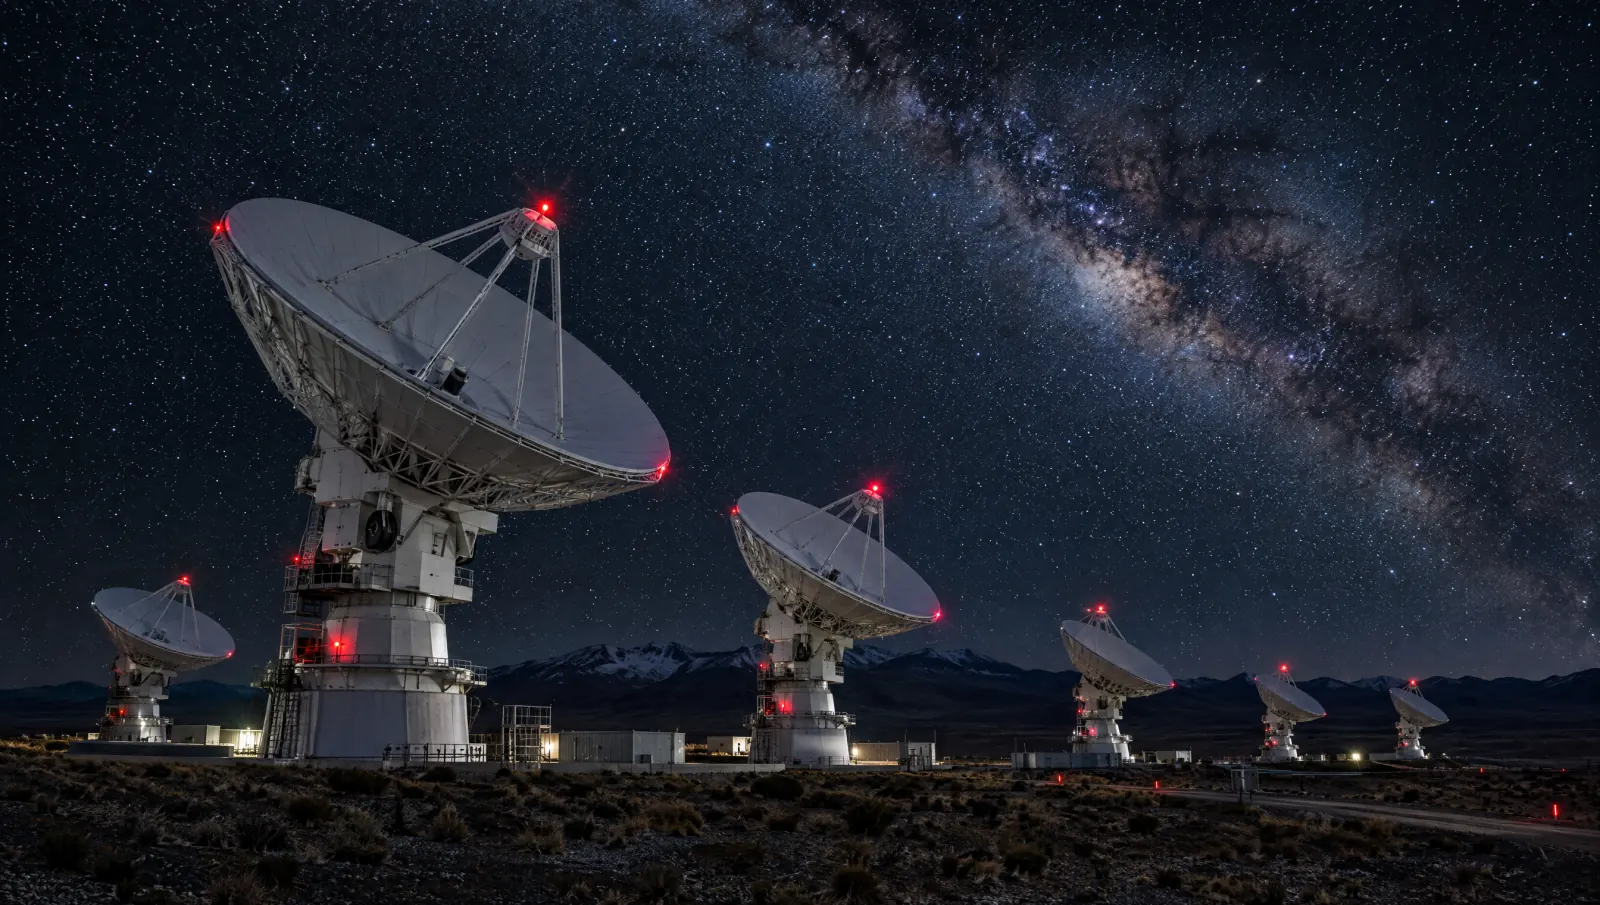
Antennas, power, cooling and the data links to orbit, watched as one site. A tracking fault or a lost feeder shows the passes it will cost and the services that ride on them.
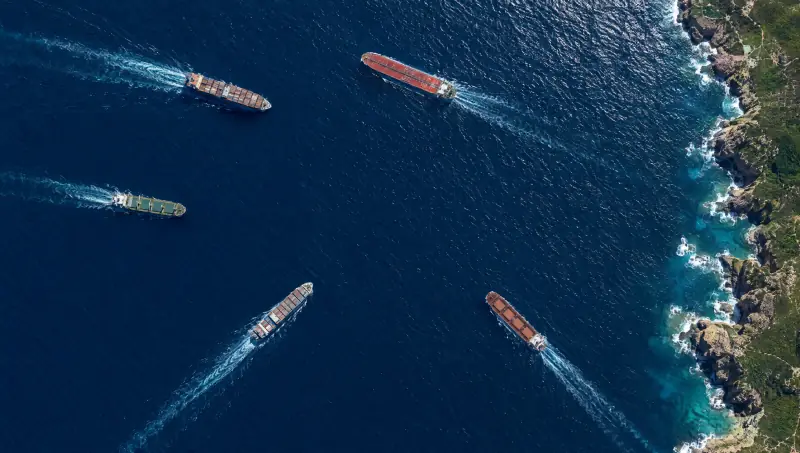
Berths, cranes, tank farms and the vessels approaching them, alongside the pipeline and the grid that keep a terminal working. A ship that goes dark on the approach, or a terminal losing supply, shows up in the same picture.
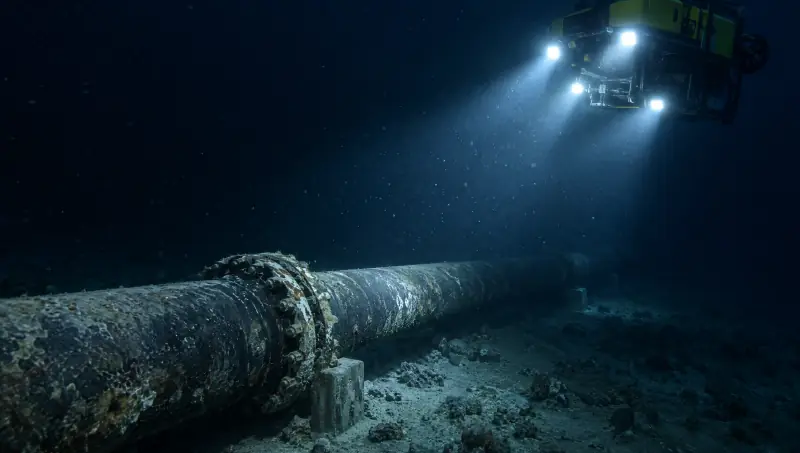
Backbone routes, exchanges, landing stations and the cables offshore. When a route is cut or a landing station loses power, Vamocles shows which services and sites were carried on it.
Tell us what you run and what you worry about. We will walk you through your network as one system: what depends on what, and how Vamocles would command it.